strategic Reporting at Scale
How Hierarchies Unlocked Analytics for CPG Brands
Role
Product Design
/
Company
Vividly
/
Industry
Enterprise Financial Analytics
/
Duration
12 Months
/
Year
2025

Overview
(00)
It's easy for brands like Health Ade Kombucha to see their sales performance is in one store, but what about every store they sell through? It gets overwhelming, fast.
Vividly helps Consumer Packaged Goods (CPG) companies manage their finances. Reporting limitations forced users to export reports to third-party tools for basic analysis.
Vividly helps Consumer Packaged Goods (CPG) companies manage their finances. Unfortunately, reporting limitations forced users to export reports to third-party tools for basic analysis.
My solution modernized Vividly's reports & data analysis features, addressing high impact user needs and closed a critical business gap.
Understanding the Problem
(01)
Vividly's reports can't group customers or products, preventing analysis like trends, year over year, or regional insights
Users exported to external BI tools to analyze performance.
Nested content organization is a must have.
Users exported to third-party BI tools for basic analysis
Nested content organization was essential, but Vividly only offered flat tagging
Workaround: Users tagged items with categories, but tags don't enable true grouping
Data exports added friction and created a competitive vulnerability.
Data exports added friction and opened the door for competitors to lure customers away

The original Promotion Analytics feature
Design Process
(02)
Stakeholders assumed mimicking other platforms' "mindmap style" visualizations was what users wanted for handling their CPG products and customers. Discovery showed the real need was true content management with robust metadata.
I interviewed internal experts and CPG Sales & Finances users
I interviewed internal experts and CPG Sales & Finances users
The platform assumed users wanted per-product or per-customer information. Research showed that users also needed high-level information to be effective.
Understanding trends (YoY, regional sales) helps businesses see what's working and diagnose problems—like a promotion that underperforms or an incident causing sales decline.
Stakeholders assumed mimicking other platforms' "mindmap style" visualizations was what users wanted for handling their CPG products and customers. Discovery showed the real need was true content management with robust metadata.
Solution
(04)
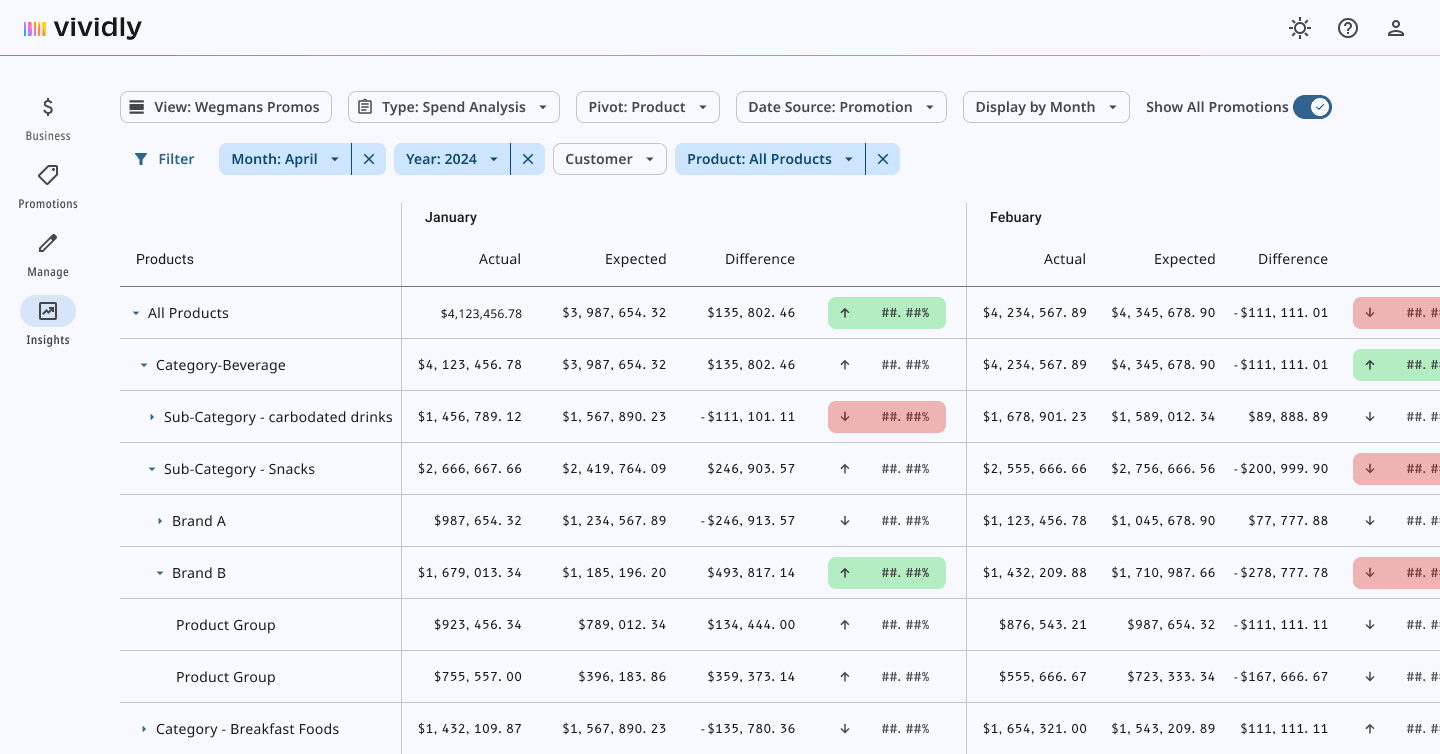
Aggregated analytics help users analyze performance at any level of the business

Saved views let users save commonly-used reports, reducing repetitive manual tasks
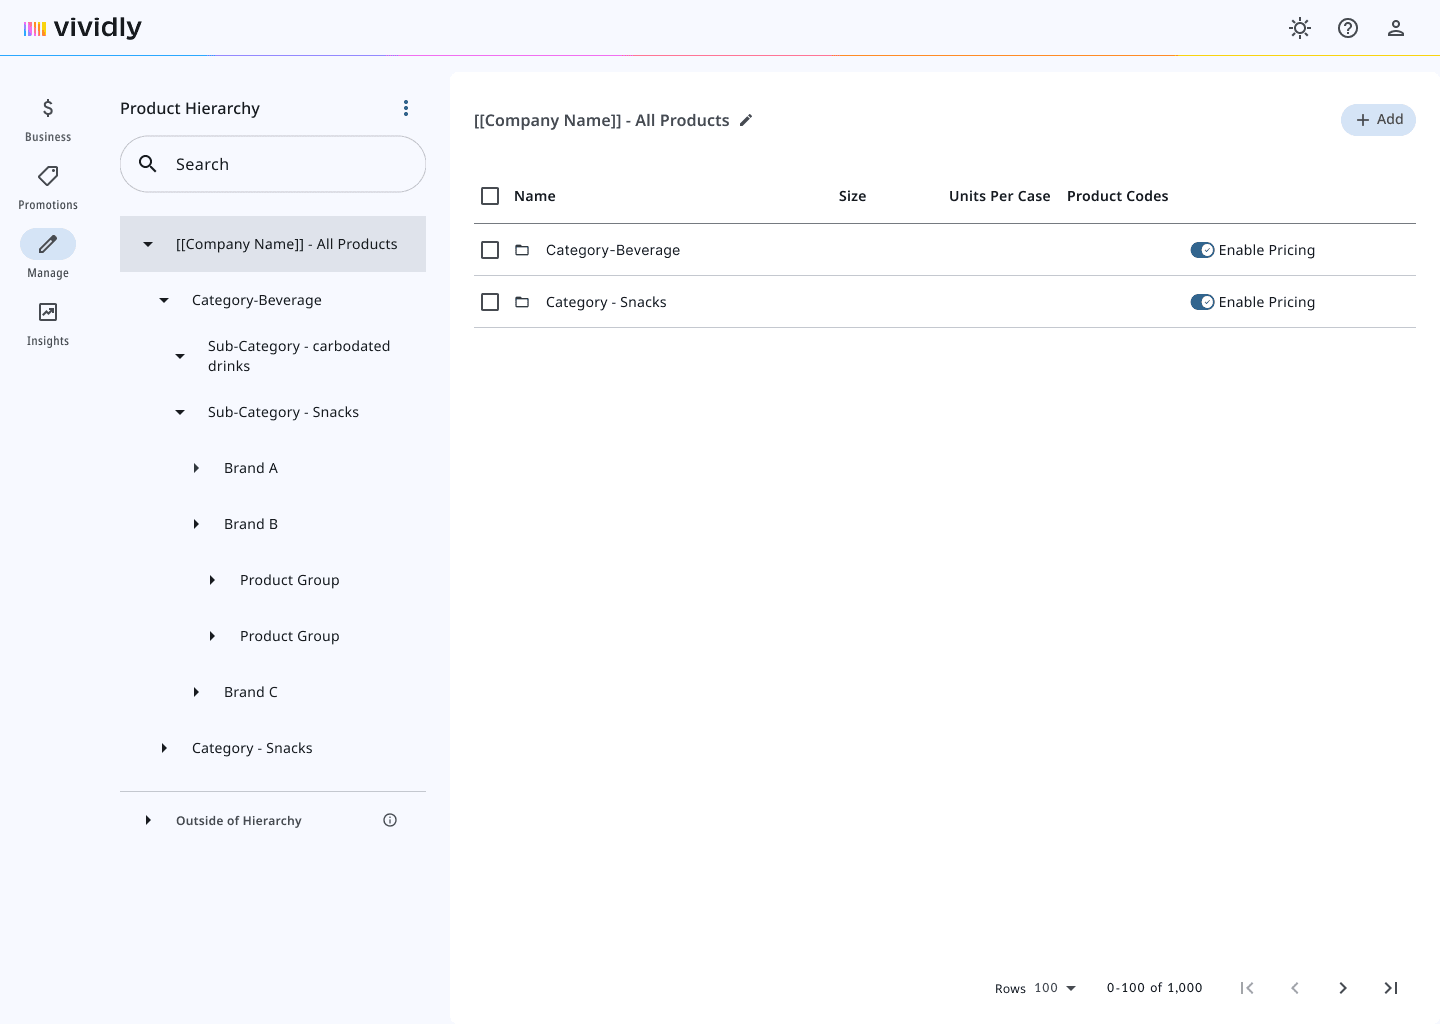
Folder-based content management matches ERPs and improves downstream analysis
Impact & Outcomes
(05)
The solution reduced cognitive load through familiar patterns and focused workflows
Daily exports reduced from 3-5/day to as-needed. In-app analysis replaced third-party tools.
Validated at scale: Users across 3 mid-market accounts created hierarchies with up to 500 products and 800+ customers. Performance stayed under 2 seconds.
100% of beta users accepted manual setup, validating a phased approach where upfront work delivers long-term value.
Reduced churn threat. Users responded positively to aggregated metrics and nested filtering.
Platform-wide impact: Data structure improvements enhanced existing features (Budget & Forecast) and unlocked new workflows like demand planning and year-over-year analysis.
strategic Reporting at Scale
How Hierarchies Unlocked Analytics for CPG Brands
Role
Product Design
/
Company
Vividly
/
Industry
Enterprise Financial Analytics
/
Duration
12 Months
/
Year
2025
strateGic Reporting at Scale
How Hierarchies Unlocked Analytics for CPG Brands
Role
Product Design
Company
Vividly
Industry
Enterprise Financial Analytics
Duration
12 Months
Year
2025
Solution
(04)
Aggregated analytics help users analyze performance at any level of the business
Saved views let users save commonly-used reports, reducing repetitive manual tasks
Folder-based content management matches ERPs and improves downstream analysis
Impact & Outcomes
(05)
The solution reduced cognitive load through familiar patterns and focused workflows
Daily exports reduced from 3-5/day to as-needed. In-app analysis replaced third-party tools.
Validated at scale: Users across 3 mid-market accounts created hierarchies with up to 500 products and 800+ customers. Performance stayed under 2 seconds.
100% of beta users accepted manual setup, validating a phased approach where upfront work delivers long-term value.
Reduced churn threat. Users responded positively to aggregated metrics and nested filtering.
Platform-wide impact: Data structure improvements enhanced existing features (Budget & Forecast) and unlocked new workflows like demand planning and year-over-year analysis.
Understanding the Problem
(01)
Vividly's reports can't group customers or products, preventing analysis like trends, year over year, or regional insights
Data exports added friction and created a competitive vulnerability.
Users exported to external BI tools to analyze performance.
Nested content organization is a must have.
The original Promotion Analytics feature
Design Process
(02)
Stakeholders assumed mimicking other platforms' "mindmap style" visualizations was what users wanted for handling their CPG products and customers. Discovery showed the real need was true content management with robust metadata.
I interviewed internal experts and CPG Sales & Finances users
What I learned
The platform assumed users wanted per-product or per-customer information. Research showed that users also needed high-level information to be effective.
Understanding trends (YoY, regional sales) helps businesses see what's working and diagnose problems—like a promotion that underperforms or an incident causing sales decline.
Stakeholder resistance: Other platforms used visual box-and-line representations for hierarchy. Stakeholders assumed we should follow.
My response: I prototyped content management layouts with real CPG data and tested with users. Positive feedback showed file-system style organization provided more value than visualizations. Stakeholders agreed to move forward.
Overview
(00)
It's easy for brands like Health Ade Kombucha to see their sales performance is in one store, but what about every store they sell through? It gets overwhelming, fast.
Vividly helps Consumer Packaged Goods (CPG) companies manage their finances. Unfortunately, reporting limitations forced users to export reports to third-party tools for basic analysis.
My solution modernized Vividly's reports & data analysis features, addressing high impact user needs and closed a critical business gap.
Impact & Outcomes
(05)
The solution reduced cognitive load through familiar patterns and focused workflows
Daily exports reduced from 3-5/day to as-needed. In-app analysis replaced third-party tools.
Validated at scale: Users across 3 mid-market accounts created hierarchies with up to 500 products and 800+ customers. Performance stayed under 2 seconds.
100% of beta users accepted manual setup, validating a phased approach where upfront work delivers long-term value.
Reduced churn threat. Users responded positively to aggregated metrics and nested filtering.
Platform-wide impact: Data structure improvements enhanced existing features (Budget & Forecast) and unlocked new workflows like demand planning and year-over-year analysis.
Solution
(04)
Aggregated analytics help users analyze performance at any level of the business
Saved views let users save commonly-used reports, reducing repetitive manual tasks
Folder-based content management matches ERPs and improves downstream analysis
Design Process
(02)
Stakeholders assumed mimicking other platforms' "mindmap style" visualizations was what users wanted for handling their CPG products and customers. Discovery showed the real need was true content management with robust metadata.
I interviewed internal experts and CPG Sales & Finances users
The platform assumed users wanted per-product or per-customer information. Research showed that users also needed high-level information to be effective.
Understanding trends (YoY, regional sales) helps businesses see what's working and diagnose problems—like a promotion that underperforms or an incident causing sales decline.
Understanding the Problem
(01)
Vividly's reports can't group customers or products, preventing analysis like trends, year over year, or regional insights
Data exports added friction and created a competitive vulnerability.
Users exported to external BI tools to analyze performance.
Nested content organization is a must have.
The original Promotion Analytics feature
Overview
(00)
It's easy for brands like Health Ade Kombucha to see their sales performance is in one store, but what about every store they sell through? It gets overwhelming, fast.
Vividly helps Consumer Packaged Goods (CPG) companies manage their finances. Unfortunately, reporting limitations forced users to export reports to third-party tools for basic analysis.